Summarize this article with:
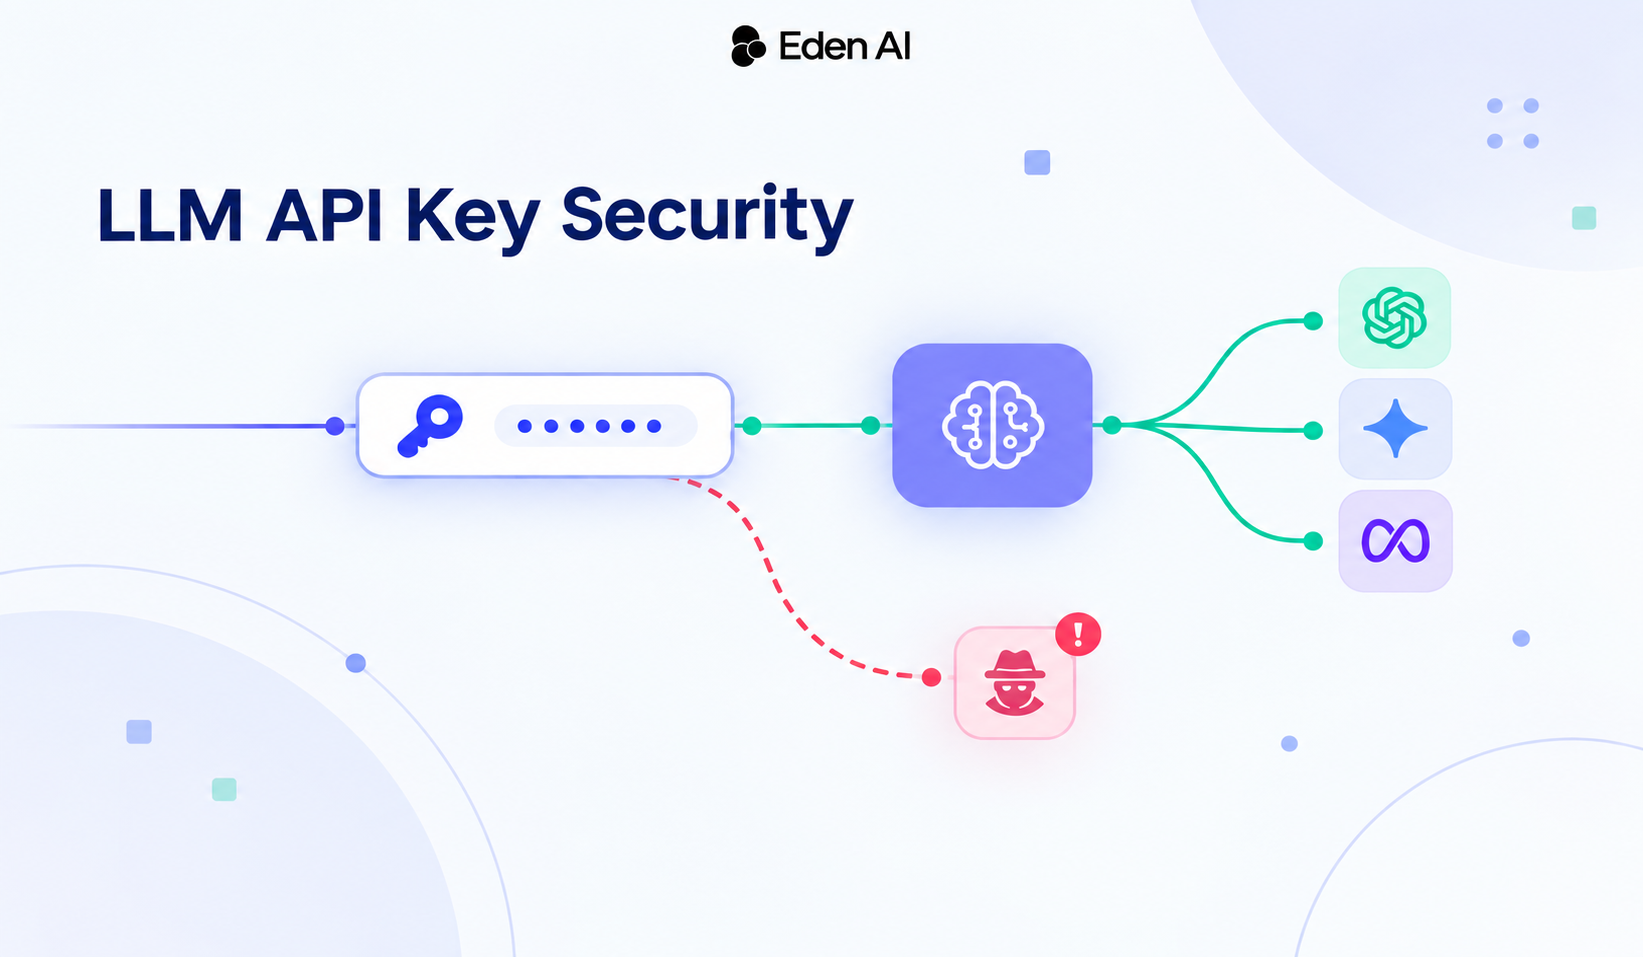
Unusual LLM API usage can signal a compromised credential, but a traffic spike alone rarely explains what happened. Reliable attribution requires connecting credentials to their expected workloads and analyzing changes in request rates, model usage, token consumption, timing, regions, and networks. By combining these signals with centralized AI traffic visibility, teams can identify behavioral mismatches, investigate suspicious activity, and reduce the blast radius of compromised credentials.
A sudden increase in AI usage is easy to notice. Understanding why it happened is much harder.
That distinction matters as AI applications move from occasional API calls to always-on agents, background workers, coding assistants, automated workflows, and production services. A credential that was once used by a developer for a few requests per day may now sit behind hundreds of automated calls per hour.
If that credential is exposed, a simple usage dashboard may tell you that consumption increased. It may not tell you which workload caused it, whether the activity was legitimate, or whether the credential is being used somewhere it was never intended to be.
This is the difference between detection and attribution.
In September 2026, a Claude Max subscriber reported that their token usage continued increasing while they were not actively working. Anthropic investigated and told the user that a compromised Claude session key had been used to mint unauthorized Claude Code OAuth tokens. Anthropic also warned other affected users about infostealer malware that could steal Claude login sessions.
The incident is a useful reminder of a broader production problem: AI credentials need behavioral monitoring, not just authentication.
This guide explains how to build that monitoring layer using request metadata, workload-aware baselines, and anomaly detection; without needing to inspect the content of user prompts.
A Usage Spike Is Not the Same as an Explanation
Suppose your AI infrastructure normally processes 50,000 tokens per hour.
One morning, the number jumps to 300,000.
That is an anomaly. But it is not yet an explanation.
The increase could come from:
- a legitimate product launch
- a new agent workflow
- a model migration
- a retry loop
- longer context windows
- a batch job
- a provider-side change
- a compromised credential
The aggregate number tells you what happened to consumption. It does not necessarily tell you which workload produced it.
This becomes particularly difficult when several applications share the same provider account or API credential.
A single production key might be used by:
customer-chat
support-agent
document-worker
internal-copilot
scheduled-reports
If total usage doubles, the provider dashboard may correctly report the increase.
Your security team still has another question: Which workload generated the unexpected traffic?
That is the attribution problem.
Detection vs. Attribution
It helps to separate AI usage monitoring into three levels.
1. Consumption
How much are we using?
Examples:
- requests
- input tokens
- output tokens
- cost
- latency
This is the level most basic dashboards expose.
2. Detection
Is the current behavior unusual?
Examples:
- request volume is significantly above its normal range
- a model suddenly appears in a workload that never used it before
- traffic occurs at unusual times
- token consumption changes dramatically
This requires a baseline.
3. Attribution
Which credential, application, environment, or workload produced the anomaly?
Examples:
This requires structured request metadata.
The important point is that detection without attribution creates an investigation problem.
You know something changed, but you still have to search through logs, applications, credentials, and provider dashboards to find the source.
Why Production AI Credentials Are Different
Traditional API credentials were often associated with a relatively predictable application.
AI applications are increasingly less predictable.
An LLM request may be generated by:
- an interactive user,
- an autonomous agent,
- a scheduled worker,
- a queue consumer,
- a CI/CD pipeline,
- a coding assistant,
- a background summarization job,
- or another model acting as an orchestrator.
Agents make the problem even more interesting.
A normal application might produce:
An agent can produce:
A legitimate workload can therefore generate large and variable amounts of traffic.
That means a simple rule such as “More than 1,000 requests per hour = compromised” is not particularly useful. The detector needs to understand the normal behavior of each workload.
Six Signals That Can Reveal Credential Anomalies
No single signal proves that an API key has been compromised.
The useful approach is to combine several independent signals and investigate when multiple ones move together.
1. Credential-to-Workload Mismatch
Every credential should have an expected purpose. For example:
Now imagine support-prod suddenly starts making requests associated with the research workload.
That is not automatically malicious. It could be a deployment mistake.
But it is exactly the kind of event that deserves investigation.
The important signal is not “This key made a request.”, it is “This key made a request that does not match its established workload.”
2. Model-Mix Drift
The distribution of models used by an application is often surprisingly stable.
Suppose a support application normally looks like:
Model A    72%
Model B    23%
Model C     5%
Then suddenly:
Model A    18%
Model B    12%
Model C    70%
The total request volume might barely change. A simple spend alert could therefore miss the event.
Model-mix drift can reveal changes that aggregate token counts hide.
Possible explanations include:
- a new deployment,
- a routing change,
- a fallback being triggered,
- an incorrect configuration,
- or unexpected credential usage.
Again, the signal is not proof of compromise. It is evidence that the workload changed.
3. Request-Rate Deviation
Measure request volume against the workload's own history.
For example: support-agent-prod
Normal:
09:00 → 120 requests
10:00 → 145 requests
11:00 → 138 requests

Observed:
09:00 → 130 requests
10:00 → 151 requests
11:00 → 1,842 requests
A global threshold might be too crude because different applications have different traffic profiles.
A production API serving millions of users and a nightly reporting job should not share the same threshold. The baseline should be workload-specific.
For some applications, the relevant comparison may be the same hour on recent weekdays. For others, weekly or monthly patterns may matter more. The important thing is to compare like with like.
4. Token-Consumption Deviation
Request counts are not enough. One request can consume a few hundred tokens. Another can consume hundreds of thousands.
Track at least input tokens, output tokens, total tokens, and, where available, reasoning or cached-token usage.
A useful metric is token consumption per request. If request volume remains stable but average token consumption suddenly increases, the underlying workload may have changed.
That could indicate:
- longer contexts,
- a prompt or retrieval change,
- an agent loop,
- a model migration,
- or unexpected activity.
5. Temporal Drift
Production workloads have time patterns.
A customer-support service might be busiest during business hours.
A batch pipeline might run every night.
A development environment might be active during working hours and nearly silent overnight.
An unexpected credential can break that pattern. For example:
Normal:
08:00–20:00 → active
20:00–08:00 → near zero

Observed:
02:13 → 900 requests
02:17 → 1,400 requests
02:22 → 1,900 requests
That does not prove credential theft.
But if the workload has historically been inactive at that time, the event becomes much more interesting.
Time should therefore be treated as a feature of the workload, not simply as a timestamp in a log.
6. Network and Region Drift
If your infrastructure normally operates from a known set of environments or regions, a sudden change can be another useful signal.
For example: support-prod
Again, there are legitimate explanations.
- Cloud migrations happen.
- Developers deploy from new regions.
- VPNs change apparent locations.
But network or region drift becomes much more valuable when combined with other anomalies. For example:
s considerably more interesting than any one of those events by itself.
Metadata Is Often Enough
Security monitoring does not necessarily require storing user prompts.
For many operational questions, request metadata is enough.
A useful event schema can look like:
timestamp
credential_id
application
environment
model
provider
tokens_in
tokens_out
source_region
status
latency_ms
request_id
You can add:
request_id
deployment_id
user_or_service_id
if those identifiers are appropriate for your environment.
The advantage is that the monitoring system can answer questions such as:
- Which key generated this traffic?
- Which application used it?
- Which model was called?
- When did the behavior change?
- Which region did the request come from?
without retaining the actual prompt or model response.
This is also a useful privacy principle: Collect the minimum data required to answer the operational question.
If metadata can identify a suspicious workload, there may be no reason to retain the full contents of every request for security monitoring.
Building a Metadata-Only Anomaly Detector
You do not need a sophisticated ML system to build a useful first version.
Start with a structured request log.
For each workload, build a baseline representing its normal operating cycle.
For a service with daily traffic patterns, you might compare:
Monday 10:00
vs.
previous Mondays around 10:00
rather than comparing Monday morning to Sunday night.
A 14-day history can be a reasonable starting point for a continuously running service, but the right window depends on the workload. Highly seasonal applications may require much longer baselines, while a new workload may not yet have enough history for reliable anomaly detection.
For noisy production workloads, robust statistics such as the median and median absolute deviation (MAD) can be useful.
median(x)
MAD = median(|x - median(x)|)
The median gives you a typical value, while MAD provides a measure of how much normal observations tend to vary around it. Unlike a simple average, these measures are less easily distorted by a small number of unusually large requests.
You do not need to turn this into a complex statistical system. The important part is choosing the right baseline and comparing like-for-like workloads and time periods.
For most teams, this can start as a lightweight internal monitoring workflow built from existing application or gateway telemetry. More advanced organizations can combine several behavioral signals — such as request volume, model usage, token consumption, timing, and source information — into a dedicated detection workflow.
For clients with more advanced security and monitoring requirements, Eden AI can support customized approaches to identifying unusual AI usage patterns using centralized AI traffic and usage data. These are not a standard built-in anomaly-detection feature of the platform; rather, they can be addressed as part of more advanced client requirements.
Why Median + MAD Can Be Better Than "Just Use Standard Deviation"
Consider this workload:
120
135
128
142
131
127
900
The value 900 may be a legitimate batch job, or it may be suspicious.
If the detector immediately uses the mean and standard deviation, that extreme observation influences the baseline itself.
Robust statistics reduce that effect. The goal is not to magically identify an attack. It is to produce a more stable answer to “How unusual is this observation compared with this workload's normal behavior?”
That distinction is important.
An anomaly detector should be an investigation trigger, not a verdict.
From Six Signals to an Investigation
You can now evaluate each request or time window against several dimensions:
Workload mismatch
Model drift
Request-rate deviation
Token deviation
Temporal deviation
Network/region deviation
Once these signals are available, a team can combine them into an investigation workflow.
A simple monitoring workflow might produce an investigation record such as:
Credential anomaly detected

Key:
support-prod

Signals:
✓ Request rate: 8.4× baseline
✓ Model mix: significant deviation
✓ Time: outside normal operating window
✓ Region: previously unseen
✓ Token volume: 6.1× baseline
✓ Workload identity: mismatch

Action:
Investigate credential and recent deployments
Notice what the system does not say “This key has definitely been compromised.”. That would be false precision.
The detector has identified behavior that deserves investigation.
A more advanced implementation can assign weights to different signals, but those weights should come from observed workloads and operational experience rather than arbitrary numbers.
The first version can be rule-based.
The important part is having the telemetry.
A Synthetic Incident: What the Detector Sees
Consider a fictional production application called: support-agent-prod
Its normal behavior is:
Requests/hour:       100–180
Models:              Model A + Model B
Active hours:        08:00–20:00 UTC
Region:              Europe
Average tokens/request: ~3,500
At 02:14 UTC, the monitoring system observes:
Requests/hour:       1,420
Model:               Model C
Region:              Previously unseen
Average tokens/request: ~8,900
Credential:          support-prod
The detector flags the event.
What should happen next?
Not “Delete the application.”
Instead:
- Check recent deployments.
- Check whether a scheduled job ran.
- Check whether the model configuration changed.
- Check application logs for retries or loops.
- Check whether the credential was recently shared or rotated.
- Compare the activity against other environments.
- If the activity remains unexplained, rotate or revoke the credential.
This is where good observability becomes security infrastructure.
Detection Is Only Half the Job
Finding an anomaly is useful only if you can act on it.
The next question is: How much damage can one credential cause?
This is the credential's blast radius.
A single API key shared by production, staging, development, internal tools, CI, has a much larger blast radius than separate credentials for each workload.
A better structure is:
support-prod       → key A
research-prod      → key B
batch-worker       → key C
staging            → key D
development        → key E
Now an anomaly in support-prod does not automatically require rotating every credential in the organization.
Good credential hygiene therefore includes:
- separate keys by workload,
- separate keys by environment,
- least-privilege access,
- regular rotation,
- short-lived credentials where practical,
- spending limits,
- rate limits,
- and a tested revocation process.
The last point is easy to overlook.
A security control that exists only in documentation is not a reliable control.
Teams should periodically test:
- Can we identify the affected key?
- Can we revoke it quickly?
- Can we determine what workload was using it?
- Can we restore service with a replacement credential?
What an AI Gateway Can — and Cannot — Do
An AI gateway creates an additional control point between applications and model providers.
Instead of:
you can have:
This architecture can make credential management, routing, usage tracking, and policy enforcement much easier.
For example, Eden AI provides a unified gateway for 500+ AI models across 50+ providers through a single API. Its V3 platform supports model routing, fallbacks, and cost tracking.
Instead of independently collecting telemetry from every provider, an organization can normalize important request-level metadata around a common gateway layer.
Eden AI's fallback system also allows applications to specify backup models when a primary provider or model fails, which is useful for resilience but should be reflected in monitoring: a fallback event can legitimately change the model distribution of a workload.
That distinction matters.
A monitoring system that treats every model change as suspicious will generate noise.
A monitoring system that knows:
can distinguish an expected routing event from an unexplained model drift.
But a gateway is not a security silver bullet.
If an attacker steals a credential that is still valid, a gateway cannot automatically determine whether every request made with that credential is malicious.
And if the endpoint is compromised before the request reaches your gateway, the gateway cannot repair the compromised machine.
Its role is different: Make credentials easier to control, activity easier to observe, and suspicious behavior easier to investigate.
The gateway doesn't have to prevent every credential theft to be useful. It needs to make stolen credentials harder to abuse and easier to investigate.
The Real Security Upgrade: From Keys to Workloads
The most important architectural shift is to stop thinking of an API key as the primary unit of identity.
The key is only a credential.
The more useful question is: Which workload is authorized to use this credential, and what does normal behavior for that workload look like?
That gives you a hierarchy:
Once requests are connected to that hierarchy, anomalies become much easier to understand.
For example:
Organization: Acme
Environment: Production
Application: Support Platform
Workload: Customer Support Agent
Credential: support-prod
Model: Model C
Region: Europe
Time: 02:14 UTC
Now an unexpected request is not simply “Somebody used our API key.”
It becomes “A production support workload made an unusual request outside its normal behavioral profile.”
The Takeaway
AI credential security is moving beyond the question:
- “How much did we spend?”
Production teams also need to ask:
- “Which workload spent it?”
- “Is that behavior normal?”
- “What changed?”
- “Can we revoke the affected credential without disrupting everything else?”
A usage spike is useful. An anomaly detector is better.
But attribution is what turns an anomaly into an investigation.
The practical starting point does not require storing prompts or deploying a sophisticated security platform.
Start with structured metadata.
Separate credentials by workload.
Build workload-specific baselines.
Track model, token, time, request, and network behavior.
Then alert when several signals move together.
An AI gateway such as Eden AI can provide a centralized layer for model access, routing, fallback, and usage visibility, but the underlying security principle remains the same: know what normal looks like, know which workload is responsible, and keep the blast radius of every credential small.
As AI agents become more autonomous and AI infrastructure becomes more distributed, that attribution layer will become just as important as the API key itself.
FAQ